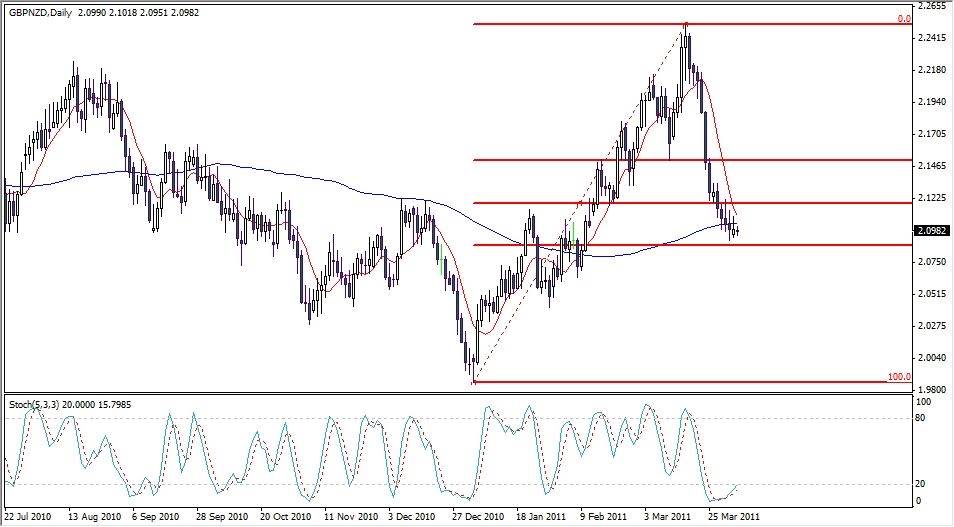
 In case of the GBP-NZD the current move is even larger, about 1600 pips, as measured from the high of 2.2520 to the low of 2.0915 reached last Friday. However, the daily progress is getting smaller and smaller, indicating that the momentum maybe running out.
When looking at the daily chart of the GBP-NZD, we can classify this sell off as a corrective move within the larger, primary bullish price swing, from 1.9858 to 2.2520. In this context, we could expect the price to reverse and resume the uptrend soon.
What's Happening Now
Currently, the GBP-NZD is at a possible important support. That is the proximity of the 62% Fibonacci retracement level, where reversals often happen. Here the price is also at the 100 SMA, another technical support/resistance tool.In addition, the Stochastic Indicator is at extremely low reading, meaning short-term oversold conditions. Altogether, the daily chart of the GBP-NZD suggests that the 2.0900-2.1000 area is vulnerable to a reversal and the price could turn around here, resuming the uptrend. http://www.dailyforex.com/forex-technical-analysis/2011/04/GBP-NZD-Testing-Important-Support/7611
No comments:
Post a Comment