Indicators such as moving averages and stochastics are generally attempting to fit onto a market. They may not necessarily work in all market conditions and they do not have any intrinsic properties that a market has to abide by. However, this is not true of Fibonacci. What I think makes Fibonacci exceptional is that the Fib ratios are inherently part of natural systems, including the markets. Fibonacci ratios do not have biases for certain market conditions or economic cycles. And Fib ratios aren’t trying to fit a certain style or market; rather they are simply a natural part of market movements.
This makes Fibonacci robust, versatile and timeless.
One of my favourite Fibonacci plays is a retracement from the 88.6% level. This level is derived by taking the 61.8% Fib Golden Ratio, square rooting it, and square rooting it again.
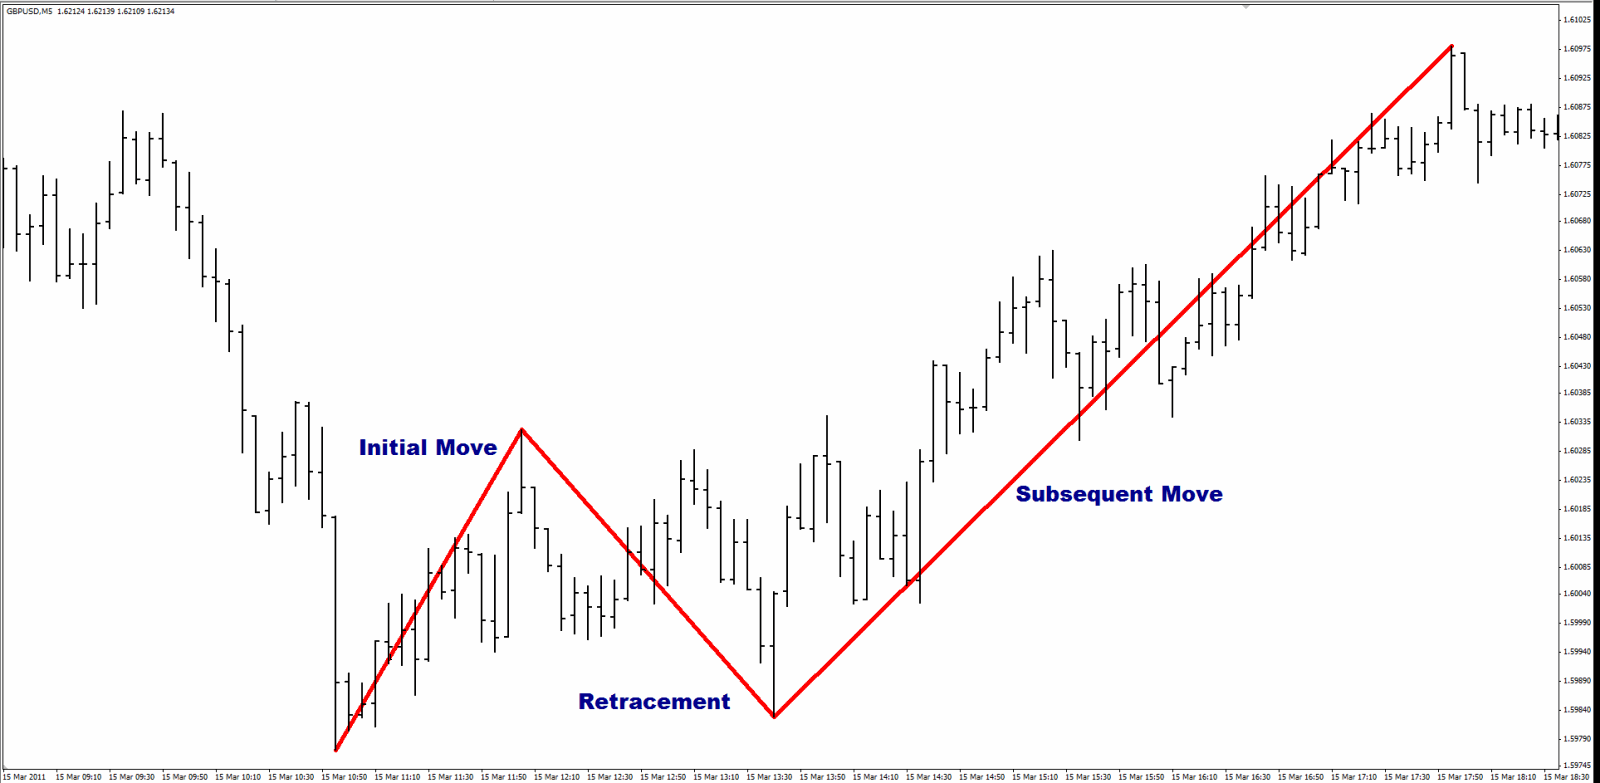
A retracement consists of an initial move, a retracement of that first move, and then the subsequent move from the retracement, like so:
 Now when I say, “This is an 88.6% Fibonacci retracement”, all that means is that the retracement is 88.6% of the size of the initial move. So if the initial move was 100 pips up, the retracement would be 88.6 pips down. It doesn’t matter if the initial move was up or down.
Here are some examples of the 88.6% Fibonacci retracement.
Firstly, a 5-Minute GBP-USD chart where the initial move was up followed by a downward retracement:
 Now a weekly USD-CHF chart, where the initial move was down followed by an upward retracement:
  This is a fantastic example of the accuracy of Fibonacci levels. After the initial move down, the price retraced back up 1,821 pips over 27 weeks, and hit the Fibonacci level within 2 pips! These kinds of setups can allow traders to have single trades that yield over 1,000 pips while still controlling their risk.
And just to showcase the versatility across markets, this is the Daily chart for the NASDAQ stock, Apple (Symbol: AAPL):
 Here the stock price moved down over $27 in four days, then retraced to within a few cents of the 88.6 level, before moving down again.
When I trade a Fibonacci retracement, I like the price to hit the level and move away within one or two bars of the timeframe I am using, i.e. not hang around the level for several bars. In the three examples above, the price bar hit the 88.6 level once, and once only. Secondly, I like the level to be respected cleanly: the price shouldn’t penetrate the level significantly; rather it should hit the level accurately.
I always trade with a stop, and my profit target is where the retracement started, i.e. the end of the initial move up or down. Often the price will surpass that target but I am happy to take my profit at this point. I will only trade this setup with a good risk/reward ratio, usually 1:2 or greater. If I can’t find a place to keep my stop at a reasonable distance compared to my target, I will pass on the trade.
So what can we learn about Fibonacci?
1. Fibonacci principles are timeless. You won’t find yourself needing to tweak or abandon Fibonacci ideas when markets change.
2. Fibonacci principles can be used from the smallest time frames to the largest.
3. Fibonacci has no biases for certain markets: you can use them on anything that has a chart, from a stock, a currency pair, a metal or even a complex derivative.
http://www.dailyforex.com/forex-articles/2011/03/Fibonacci-The-Leading-Marker/7511
No comments:
Post a Comment